
Fertilizer Market Intelligence Agent Blueprint

Every fertilizer company in India plans its season on demand numbers, and almost none of those numbers can survive a simple question: where did this come from? A district estimate travels up from the field as a round figure in a spreadsheet, adjusted by feel at two levels, and by the time it reaches the production plan it is folklore with decimals. The same fragility runs the other way: a price spike in DAP, a delayed import shipment, a competitor's move — each arrives as a rumour first and a fact too late. This blueprint builds the intelligence desk such a company actually needs, for its own business teams — product managers, regional sales heads, strategy — where every number is computed from stored data with provenance, and the agent layer drafts words and assembles views but never originates a figure.
This open blueprint, the Fertilizer Market Intelligence Agent, holds two crop years across twelve districts and both seasons — cropped area by crop, crop mix, monsoon deviation, soil nutrient status, product and feedstock prices, import arrivals, domestic production against plan, competitor series, policy events and structured field reports — in a store that only accepts new facts: writes are insert-only, so a corrected figure is a new fact under a new date and history is never rewritten. Its compute engines run on LangGraph; the pattern follows the Farmioc DataStore shape of one governed ontology under the analysis.
Consumption you can re-derive
The foundation is a discipline most market models skip: historical consumption is not an input someone typed, it is derived — cropped area times stated application rates, adjusted by soil nutrient status and monsoon deviation, by rules stated in code. In the blueprint's dataset that derivation produces 288 district-season-product consumption figures, and the evaluation re-derives every one of them from the stored inputs and compares: zero mismatches. When a planner challenges a consumption number, the answer is a recomputation, not a defence of whoever entered it.
An estimate that shows its drivers
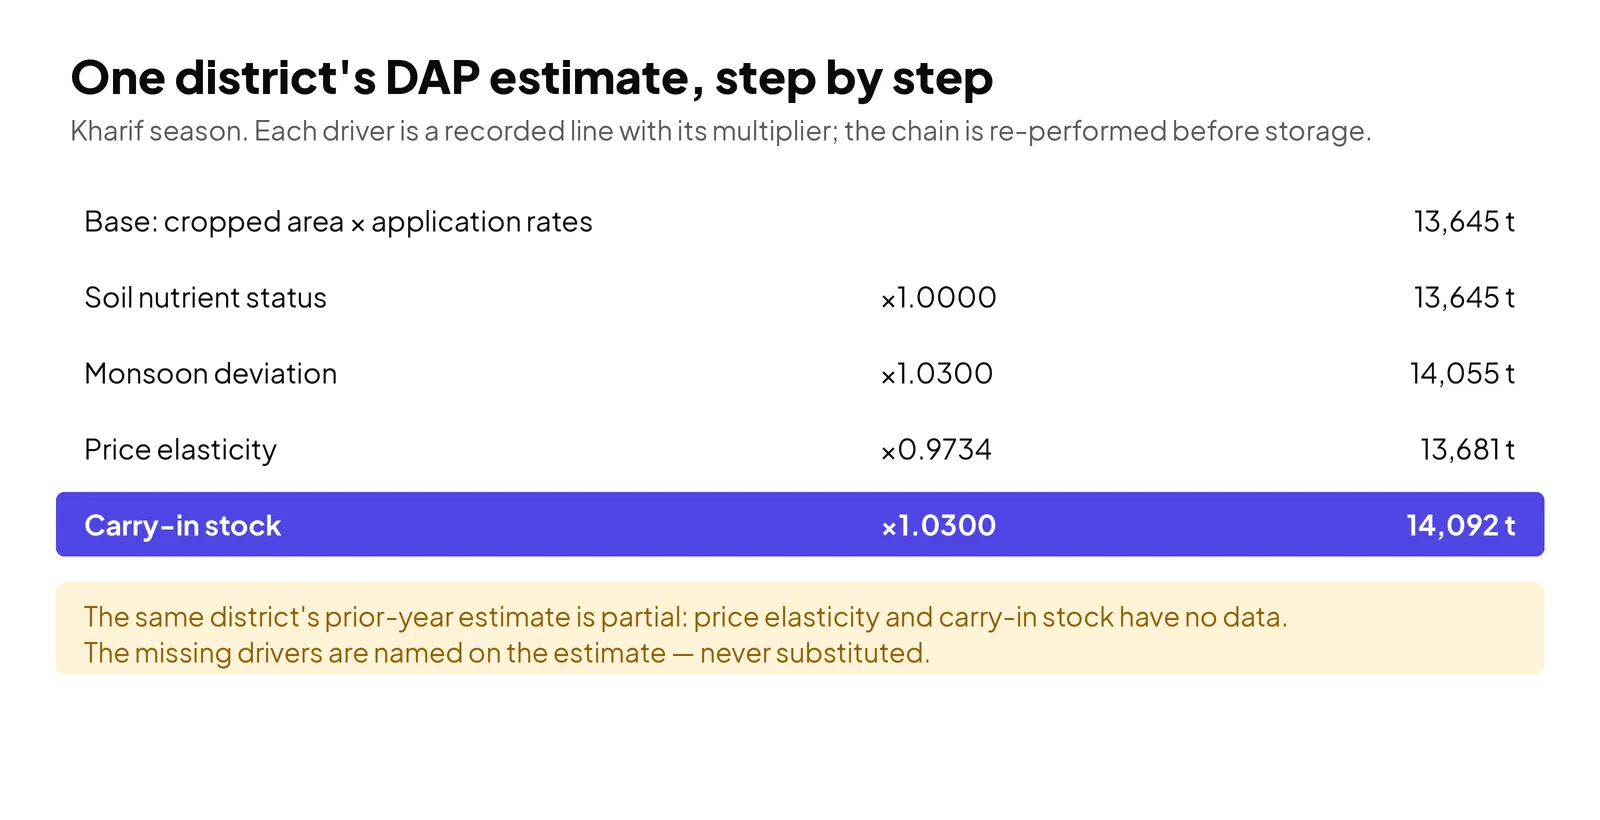
A demand estimate carries its construction on its face. The DAP estimate for one Punjab district for the kharif season starts from area and application rates at 13,645 tonnes; a soil adjustment leaves it unchanged; the monsoon deviation adds 409 tonnes; price elasticity takes back 374; carry-in stock adds 410 — landing at 14,092 tonnes, each step a recorded line with its multiplier, and the whole chain re-performed by a second route before the estimate is stored.
Just as telling is the same district's prior-year estimate: it is partial. Two drivers — price elasticity and carry-in stock — have no data for that year, and the estimate says so, naming them. Nothing is substituted, borrowed from a neighbouring year or quietly zeroed. A partial estimate with named gaps is usable; a complete-looking one with silent patches is how planning goes wrong politely.
An outlook that adds up
The season outlook rolls 72 district-product estimates into one view — in the sample season, about 712,000 tonnes in total, urea the largest share at roughly 371,000 — and the rollup is verified the same way: the total must equal the sum of its estimates, checked in code. The narrative the desk reads is generated only after its figures are verified against the artefacts; a sentence whose number cannot be resolved does not get stored. The largest single estimate in the sample — one Gujarat district's urea at about 35,000 tonnes — can be opened down to its own driver chain, and the outlook names the largest driver movement inside it.
The watch that cries once
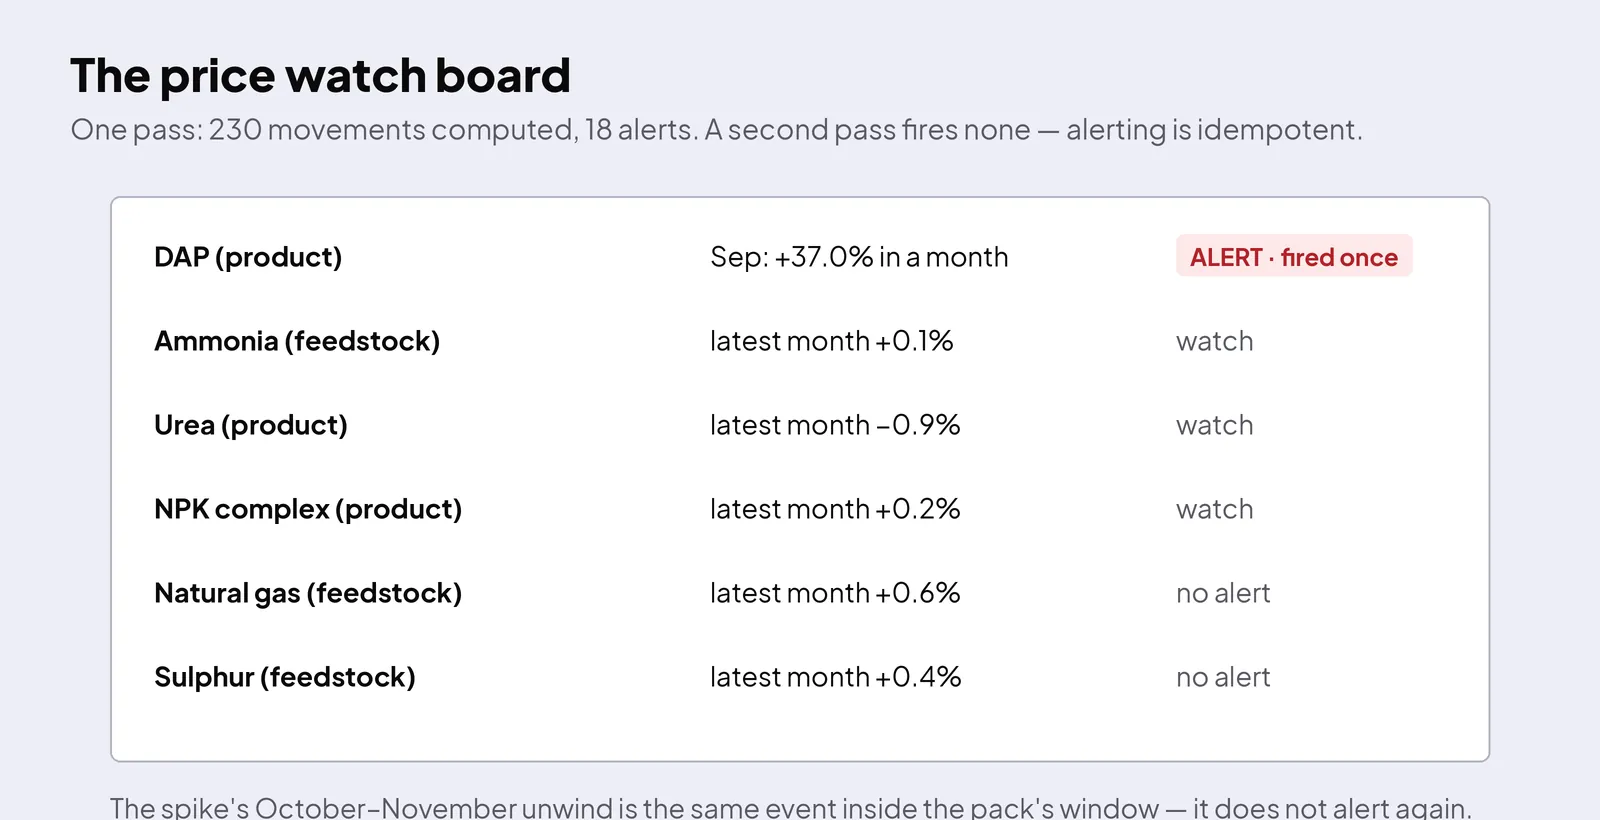
Prices are watched by a rule pack, and its manners are the point. A pass over the sample series computes 230 price movements and fires 18 alerts — and a second pass fires none, because alerting is idempotent: the same movement never pages the desk twice. When DAP spikes 37% in a single month, exactly one alert fires for the event; the following months' unwind, which a naive threshold would report as two more emergencies, is recognised as the same event inside the pack's event window and stays quiet.
An alert then lives by acts, not edits: the desk lead acknowledges it, and later closes it with a recorded reason — explained by event — while the alert artefact itself is never modified; its state is derived from the acts on it. Anyone auditing the season later sees the spike, the acknowledgement and the reasoning, in order.
A supply position that reconciles
Imports and production are tracked as a position chain: twenty-four months in the sample, each month's opening stock exactly the prior month's closing, every figure a recorded line over named facts — production, arrivals, consumption. That is what makes a disruption legible: when a DAP shipment expected in October arrives in December, the chain shows two months running on domestic production and stock, with the missing arrival named, instead of a stockout that nobody can explain in January. The gap has a name and a date, so the commercial conversation about it can start in October.
Field signals, capped and attributed
The human layer is governed too. A field report is an artefact with a named reporter, not a number whispered into a spreadsheet; aggregation shows the reports it is built from; and a single unverified report cannot move an estimate beyond a stated cap, however confident it sounds. Competitor and policy figures carry source and date, and staleness is a stated rule: a figure past its freshness window is labelled stale wherever it appears, never silently presented as current.
What this is not
One boundary is worth stating as plainly as the system states it: nothing here advises a farmer. There is no agronomy-advice surface — no crop recommendations, no dosage guidance. This is a business-intelligence tool for the input company's own teams, about markets: demand, prices, supply, competitors, policy. Keeping that line bright is part of the design, not a disclaimer pasted over it.
Work with us
If your season planning runs on folklore with decimals — estimates nobody can re-derive, spikes discovered late, a supply gap explained only in hindsight — the governed version is buildable: consumption derived from stored inputs, estimates that show their drivers and name their gaps, a watch that fires once per event, and a position chain that reconciles. Bring the problem through Trida AI's intake and we will scope what a market intelligence agent for your teams should, and should not, be allowed to claim.
Get the Code on GitHub: github.com/tridaai/blueprint-fertilizer-market-intelligence