
Commodity Forecast Agent Blueprint
Ask a large food buyer's trading desk in India the question that decides its quarter — what happens to soybean prices if the import tariff stays? — and watch how the answer is produced today: phone calls to traders, a feel for arrivals at the mandis, last year's pattern, someone's summary of the policy mood. The judgement involved is real and often good. What it is not is defensible: when the number turns out wrong, there is no record of what it was built from, which drivers were counted and which were missed, or how accurate the desk's calls have been over time. This blueprint builds the forecasting desk that keeps those records — where the forecast is a computed artefact with its arithmetic attached, and the language model's job is confined to explaining it.
This open blueprint, the Commodity Forecast Agent, covers wheat, basmati rice, soybean, groundnut, chili, cumin and coffee across their market series. Its data layer follows the Farmioc DataStore pattern — mandi prices, arrivals, stocks, trade, weather, policy and sentiment held in one ontology — and its forecast surface follows the PriceHub pattern, extended with driver contributions, sentiment and scenarios, with dashboards assembled in the TridaPad style: a question in, a governed dashboard out. The engine underneath is a stated statistical model running on LangGraph. The model never originates a price.
The forecast is computed, and it shows its arithmetic
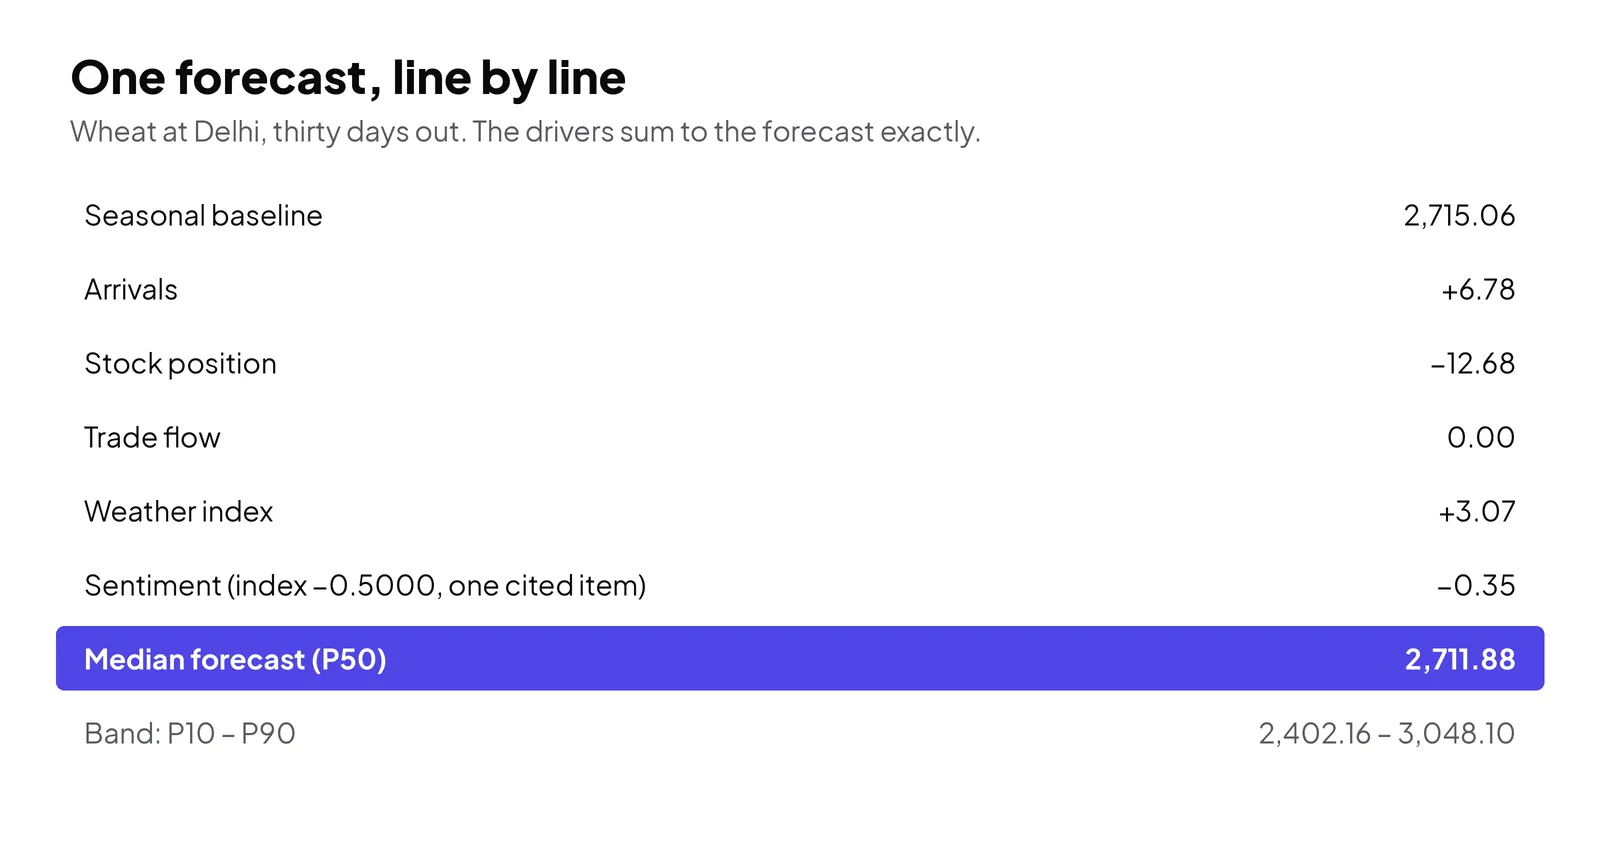
Take the wheat forecast for Delhi as of the end of December. The engine's seasonal baseline for thirty days out is ₹2,715.06 a quintal. Then the drivers speak, each as a recorded line: arrivals add ₹6.78, the stock position takes away ₹12.68, trade flow contributes nothing, the weather index adds ₹3.07, sentiment takes away ₹0.35 — landing at a median forecast of ₹2,711.88, inside a band from ₹2,402 to ₹3,048. The contributions sum to the forecast exactly, because they are the forecast: there is no separate narrative number for them to decorate.
That decomposition is the product. A buyer who disagrees with the stock line can argue with a specific input and its data, not with a mood. And before the forecast could become the desk's official view, a named head of desk approved it in a recorded act — until then it sat, labelled, as a draft.
Accuracy is printed on the forecast, not in a slide
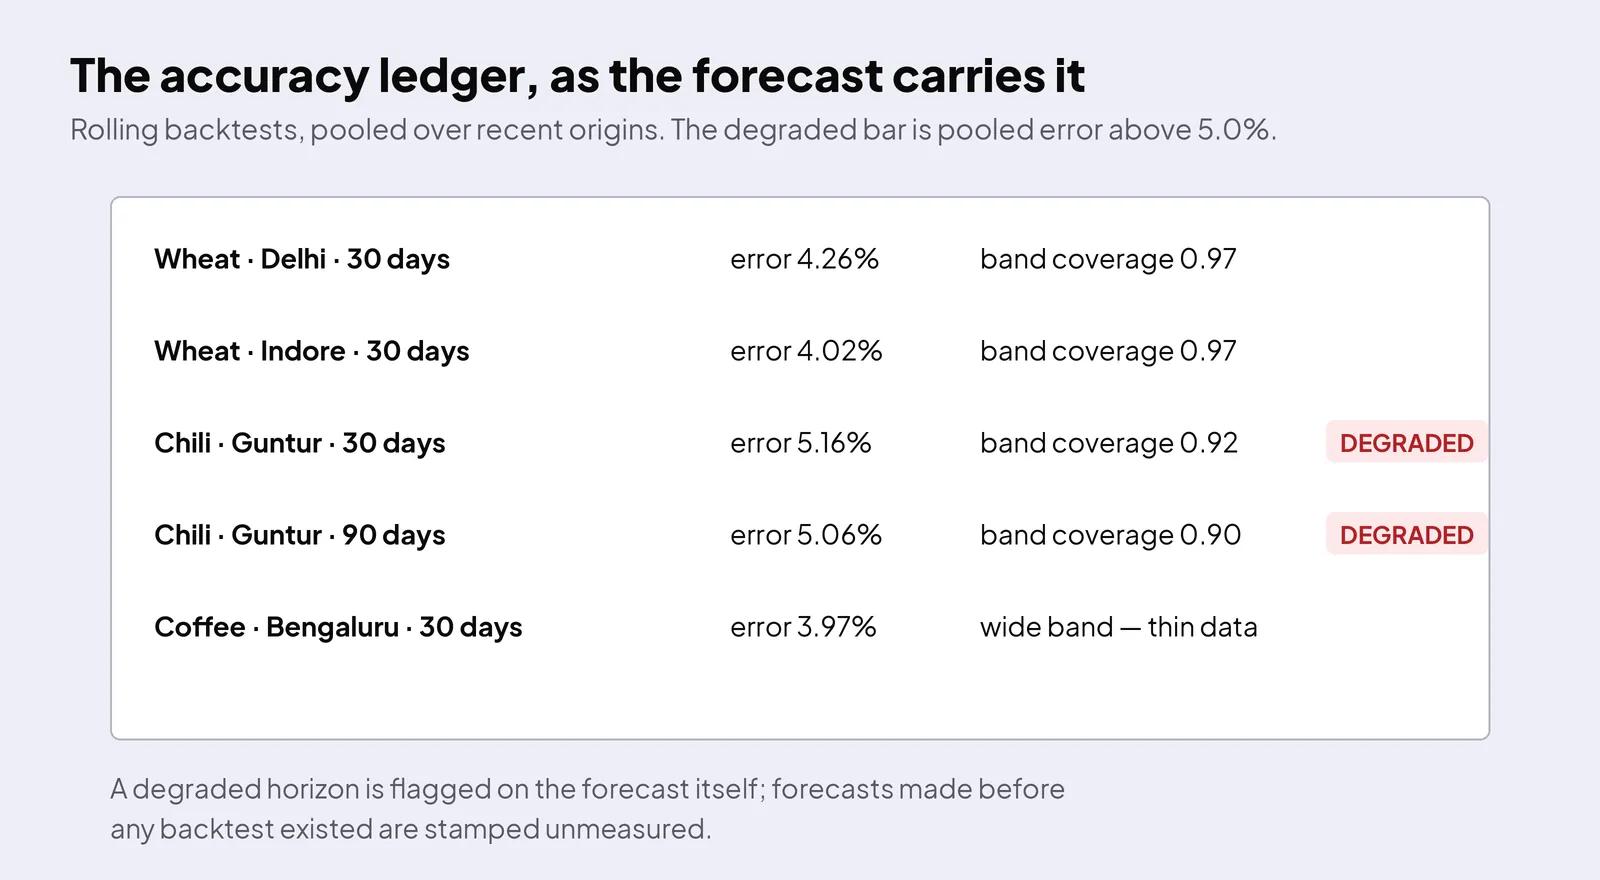
Every forecasting vendor has an accuracy slide. This system instead keeps a ledger: rolling-origin backtests score the engine per commodity and horizon, and each new forecast carries the current state of that ledger on its face. The wheat series run at roughly 4.0–4.8% error with their bands covering outcomes 92–98% of the time. Two chili horizons at Guntur breach the pack's stated bar — pooled error above 5% — and forecasts on those horizons are flagged degraded, on the artefact itself, in the commentary text as well. The flag cannot be switched off by whoever would prefer a cleaner story.
The honest states go further. Forecasts produced before any backtest existed are stamped unmeasured — the system would rather admit it does not yet know how good a forecast is than let a new number borrow confidence from a track record that was not there when it was made.
Sentiment, scored like data
Market and policy sentiment is where forecasting tools usually wave their hands, so here it is handled as data with provenance. Each item in the corpus is a record — source, date, commodity, direction, strength — scored by a stated pack, and the weekly index is computed from those records in code. In the wheat forecast the latest week's index reads −0.5000, a headwind, citing the specific item behind the reading; its contribution to the price is the modest −₹0.35 line in the decomposition. Sentiment is allowed to be small when it is small.
It is also allowed to be absent. For coffee, the index does not clear the pack's coverage floors — too few covered price days, spanning too short a calendar — so the sentiment line reads not estimable, with the failed floors named. A system that always produces a sentiment number is a system that sometimes invents one.
Shocks are declared, not absorbed
Prices jump when policy moves: a tariff lands on soybean imports, an export ban closes basmati for two months. In most models those episodes dissolve quietly into the residuals. Here they live in an event registry — each shock a declared event with its stated transmission and expected duration — and a forecast made under a shock shows the event as its own contribution lines, separate from trend and season. When the desk asks why the soybean number moved, the answer can point at the event, its assumed path, and the date it was declared, rather than at a model that has silently re-learned the world.
What-if, as a pinned fork
The desk's original question — what if the tariff stays? — is a scenario, and scenarios are governed objects. A what-if parses into named, bounded levers and runs as a new forecast pinned to its base: the base view is never overwritten, the fork carries its assumptions on its face, and promoting a scenario to the desk's official view takes the same named human approval as the base forecast did. Two people can hold two scenarios side by side and compare exactly the levers that differ.
Thin data gets a wide band, not a brave face
Coffee is the truth-teller in the set: a few hundred reporting days where the other commodities have thousands, with whole drivers — stock levels, import and export flows — missing entirely. The system names those gaps on the forecast and widens the band by a computed sparsity factor: coffee's thirty-day band runs from about ₹25,600 to ₹34,400 around its median, roughly twice the relative width of wheat's. That is what an honest forecast looks like on thin data — a wide interval and a list of what would narrow it.
Work with us
If your procurement desk's forecasts live in phone calls and spreadsheets — good judgement that leaves no record, accuracy nobody has measured, scenarios that overwrite each other — the governed version is buildable: computed forecasts with their drivers attached, an accuracy ledger that flags its own failures, sentiment and shocks treated as data, and a human signature before any number becomes the official view. Bring the problem through Trida AI's intake and we will scope what a forecasting agent on your desk should, and should not, be trusted to say.
Get the Code on GitHub: github.com/tridaai/blueprint-fmcg-commodity-forecast