Agent Tracing in Production
A support agent tells a customer their order shipped on Tuesday. It hadn't. Someone on the team goes looking for why, and what they find is the conversation: the question, the answer, a timestamp. The answer is wrong in a way that could have come from almost anywhere. The model could have misread the order record. The lookup could have returned a stale one. The prompt could have pushed it to sound certain. From the transcript alone, all three look the same.
So the team does what teams do with no evidence. They adjust the prompt, because the prompt is the part they can see.
This is the normal state of an agent in production that nobody traced. The one artifact kept is the output, the single part of the run that can't explain itself.
A run is not a reply
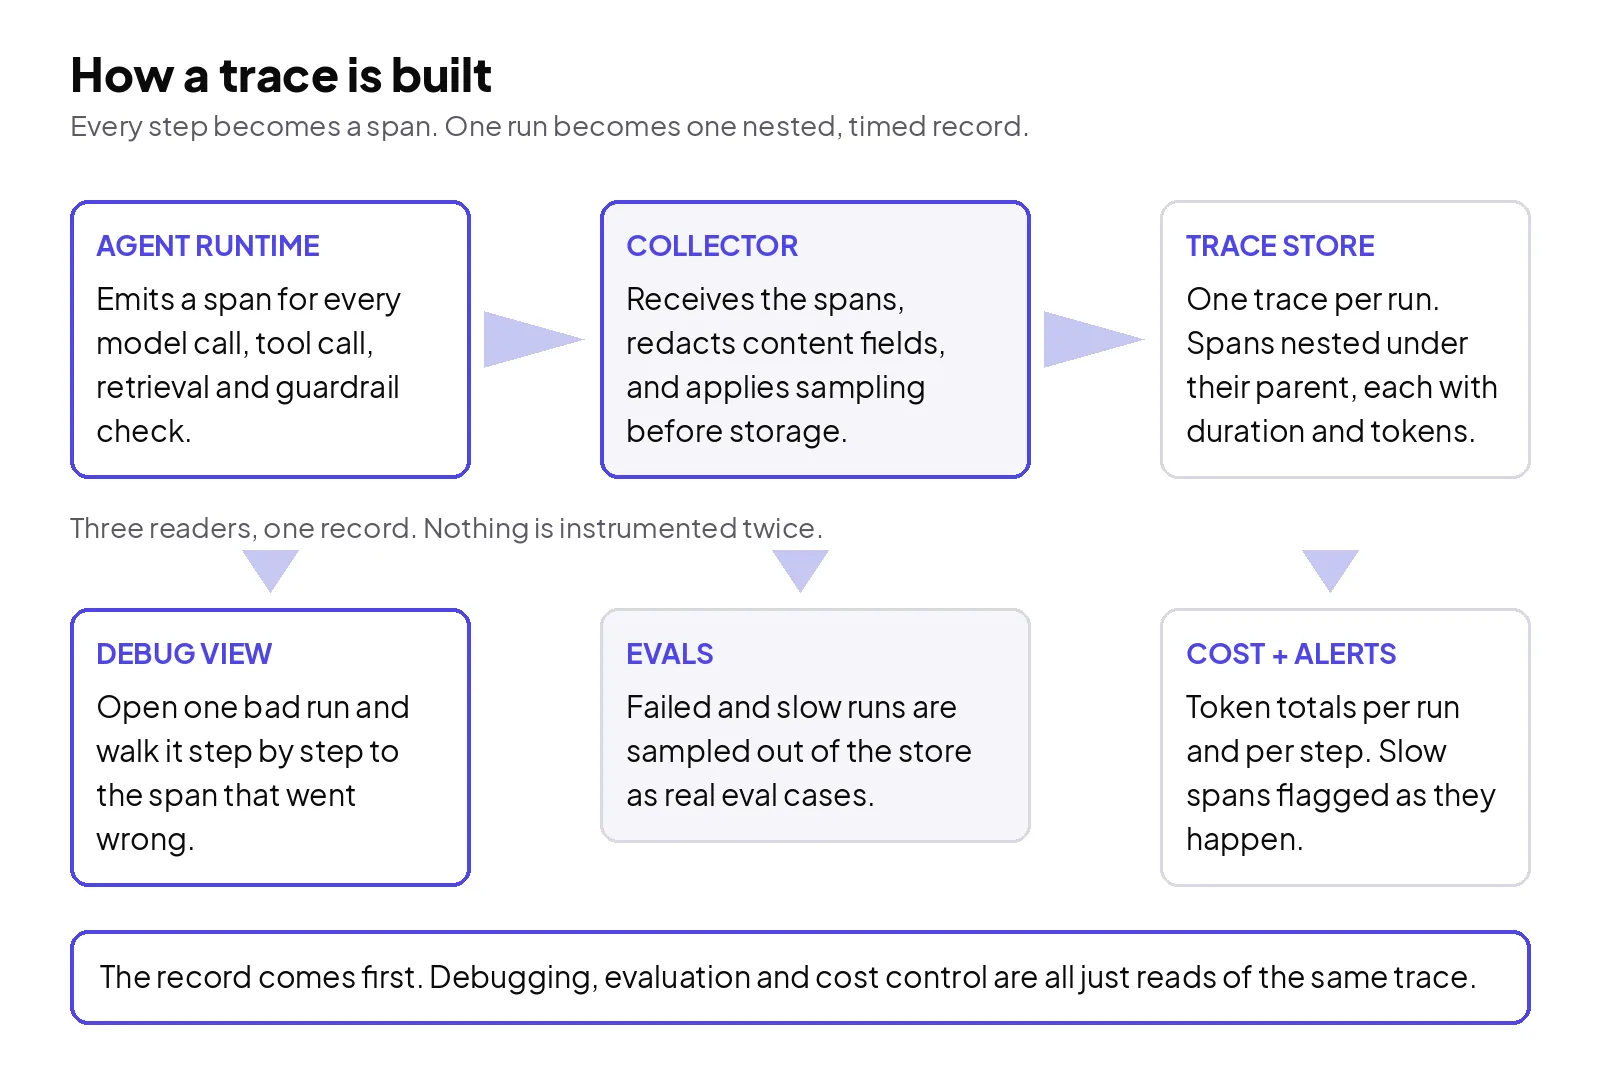
Software learned this lesson with distributed tracing years ago, and agents need the same instrument, shaped for a different kind of work. A trace is the record of one run from start to finish. Inside it, each step is a span: a timed unit with a name, a parent, and the facts about that step. A model call is a span. So is a tool call, a retrieval, a guardrail check, a handoff to another agent. The spans nest, so the run reads as a tree — this step happened inside that one, took this long, consumed this many tokens, and returned this.
The shape matters because agent failures are located. A run that goes wrong usually goes wrong at one step: the retrieval that fetched the wrong document, the tool that returned a record from Monday, the second model call that quietly dropped a condition the first one had established. A log of finished answers can't locate any of that. A span tree can, because it keeps the intermediate steps that the final text was built from, including the ones the user never saw.
The field is standardising the vocabulary. OpenTelemetry's GenAI semantic conventions give these spans shared names and attributes: an agent invocation as the parent span, model calls and tool executions as children, with the model call spans recording the model, the input and output token counts, and the reason generation stopped. Shared names sound like bookkeeping until you run more than one framework or more than one model provider. Then they are the difference between one place to look and a dialect per vendor.
Record the skeleton. Gate the content.
Two different things live in a trace, and they deserve different treatment.
The skeleton is metadata: span names, durations, token counts, model names, error states, which tool ran with what outcome. It is cheap to keep, safe to keep, and it answers most operational questions — where the time went, where the tokens went, which step failed. Record all of it, always.
Content is the other thing: the prompt text, the tool arguments, what the retrieval actually returned. That is where the debugging value sits when a run is wrong rather than slow, and it is also a copy of your customers' data landing in a second system. The major approaches disagree about the default here, which is worth knowing before you inherit one. In OpenTelemetry's conventions, content capture is opt-in; metadata is what you get unless you ask for more. OpenAI's Agents SDK tracing goes the other way: it records generations, tool calls, handoffs and guardrails by default, and its generation and tool spans store inputs and outputs unless you turn that capture off. Neither default is wrong. Both are decisions, and a team that never noticed it made one tends to find out during a security review.
Our position: capture content in production, but treat the trace store as what it is: a sensitive system. Redact before export, not after someone complains. Put a retention window on it measured in weeks, not forever. Control who can open a trace the way you control who can open the database it describes. A debugging tool your compliance team makes you switch off has helped nobody.
One run, opened up
Take the support agent from the top of this post, this time with tracing on.
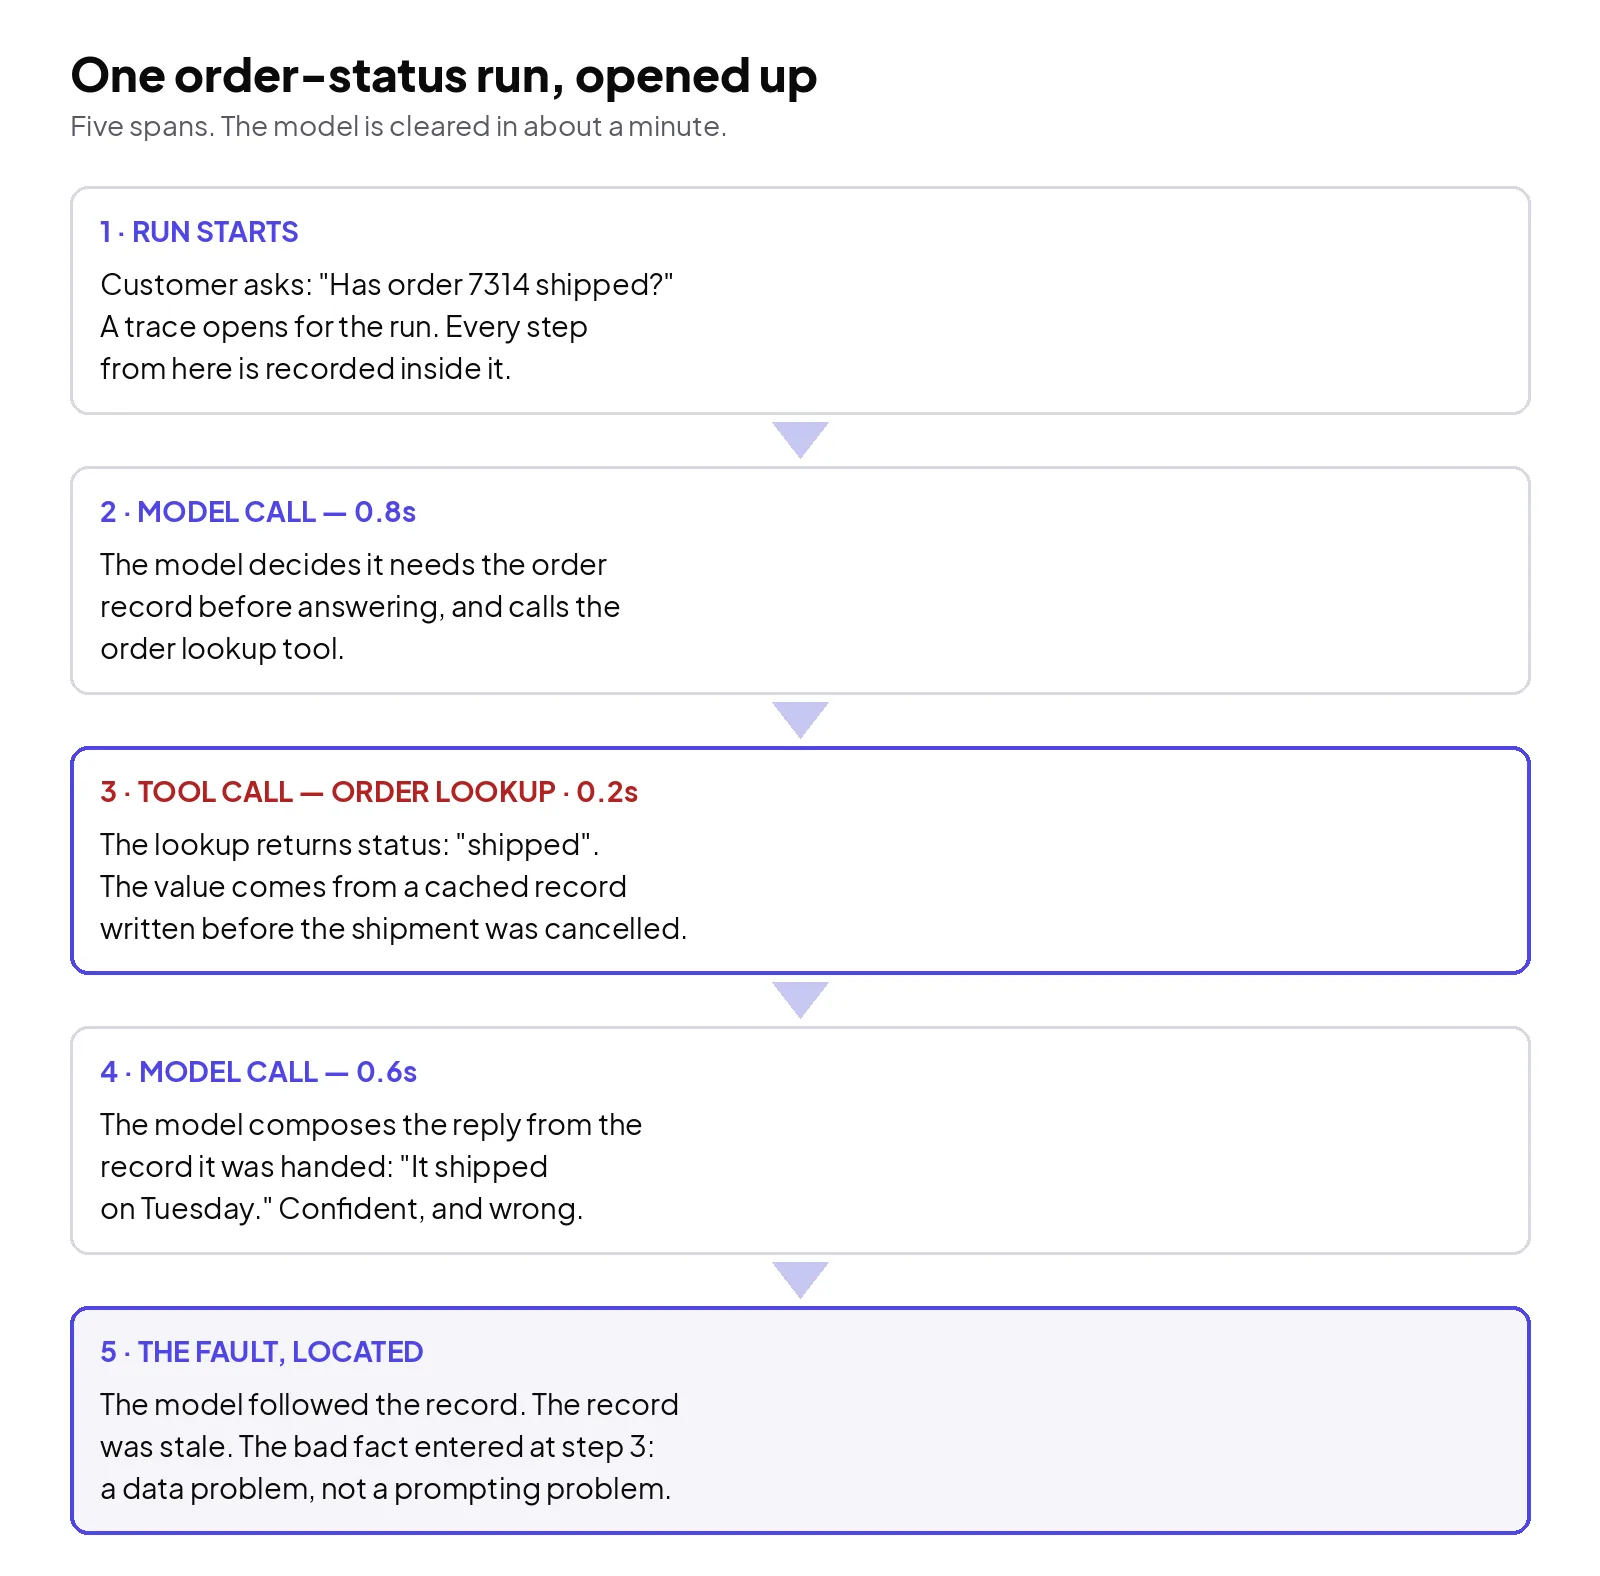
The trace shows five steps and clears the model in about a minute. It decided, correctly, that it needed the order record. The lookup returned "shipped", read from a cached record written before the shipment was cancelled. The final model call composed a polite, confident answer out of the fact it was handed. Every step did its job except the data underneath one of them.
Without the trace, that team was going to spend the week tuning prompts against a caching problem. That misdirection is the everyday cost of the missing instrument. Not the dramatic failures, but the ordinary ones getting fixed in the wrong layer, repeatedly, because the wrong layer is the visible one.
Traces are also the feedstock
A traced run is useful twice. The second use starts once the first is routine: failed, slow and expensive runs are already sitting in the store with their real inputs attached, so sampling them is how an eval set grows out of production instead of out of somebody's imagination. When a fix ships, those same runs are the regression cases. And because every span carries its token count and duration, cost stops being a monthly invoice surprise and becomes a per-run, per-step number you can argue with precisely. This run was expensive because the retrieval span fired nine times, not because "the agent is pricey".
None of that requires a separate pipeline. It requires the record to exist.
Where tracing stops helping
A trace shows what happened, in order, with timings. It does not show whether what happened was right. A run can be beautifully recorded and still be a run that should never have taken the action it took; judgment about outputs belongs to evals and review, not to the span tree.
There are gaps, and they're structural. A step that runs inside a third-party service you don't control may come back as one opaque span or nothing at all — the tree has a hole exactly where the vendor's system did the work. Sampling cuts the other way: keep one trace in a hundred and you have kept the average run and discarded the weird one you needed. Keep error traces whole, whatever else you sample. And full content capture at real volume is a genuine storage and privacy cost, which is why the skeleton-versus-content split above is a design decision and not a default to sleepwalk into.
Tracing also fixes nothing by itself. It is the precondition for fixing the right thing. Teams occasionally instrument everything, admire the waterfalls, and change nothing — the observability version of buying a dashboard instead of doing the work.
Work with us
If your team is debugging agent failures from transcripts and instinct, tuning prompts against problems that live in tools, data and retrieval, that is a tracing gap, and closing it is deployment work we do. Tell us where your runs go dark through Trida AI's intake.